Van Westendorp Price Sensitivity Meter: Questions and Example
Ask buyers when a price starts to seem too high or suspiciously low. The answers can give you a range to test, but they cannot tell you who will buy.
Written in Collaboration with AI
Ask a customer what they would pay and you get one number. You still do not know where the price starts to look too high, or so low that they doubt the product. Van Westendorp's Price Sensitivity Meter asks about both.
Each respondent answers four price questions. You plot the answers to find a range people describe as acceptable, then test an actual offer. The survey measures price perceptions; it does not tell you how many people will buy.
Dutch economist Peter van Westendorp introduced the method at the ESOMAR Congress in 1976. It remains a standard price acceptance technique used in early-stage product development (pricesensitivitymeter documentation).
The four Van Westendorp questions
Each respondent sees a description of the product and answers four open-ended price questions. A common wording, following standard descriptions of the method:
- Too expensive: "At what price would you consider the product to be so expensive that you would not consider buying it?"
- Too cheap: "At what price would you consider the product to be priced so low that you would feel the quality couldn't be very good?"
- Expensive: "At what price would you consider the product starting to get expensive, so that it is not out of the question, but you would have to give some thought to buying it?"
- Cheap, a bargain: "At what price would you consider the product to be a bargain, a great buy for the money?"
The "too cheap" answer marks the point where a respondent starts to doubt the quality because of the low price. Asking only "what would you pay?" does not capture that concern.
Respondents whose answers are out of order, for example a "cheap" price higher than their "expensive" price, are usually removed before analysis (pricesensitivitymeter R package documentation).
What the four intersection points mean
For each question you plot the share of respondents at every price. By convention, the "too cheap" and "cheap" curves are inverted so they read as "how many people think a price up to this level is (too) cheap." Inverted versions of the other two curves, "not cheap" and "not expensive," are also used. The crossings give four reference points. The definitions below follow van Westendorp's original paper as documented in the pricesensitivitymeter package:
- Point of marginal cheapness (PMC): where "too cheap" crosses "not cheap." Below it, more people think the price is too cheap than think it is not cheap. This is the lower edge of the acceptable range.
- Point of marginal expensiveness (PME): where "too expensive" crosses "not expensive." Above it, more people think the price is too expensive than think it is not expensive. This is the upper edge of the acceptable range.
- Optimal price point (OPP): where "too cheap" crosses "too expensive." The same share of people reject the price for being too low as for being too high. Van Westendorp argued resistance to the price is especially low here.
- Indifference price point (IPP): where "cheap" crosses "expensive." The same share of people see the price as cheap as see it as expensive. Van Westendorp read this as either the typical price paid in the market or the price of a leading brand.
Some research firms use a narrower range, defining the lower edge where "too cheap" crosses "expensive" and the upper edge where "too expensive" crosses "cheap." Software packages differ on this, so check which definition your tool uses before you compare results across studies.
How to run a Van Westendorp study
- Write a clear, neutral product description. Respondents price what they understand. Describe what the product does, who it is for and what is included, without marketing language.
- Recruit people who could actually buy. Screen for the target market. Prices from people outside it are noise.
- Ask the four questions as open numeric answers. Some studies show a price ladder instead. Either way, keep the format the same for every respondent.
- Clean the data. Remove out-of-order answers and obvious junk entries.
- Plot cumulative curves for each question, invert as described above, and read the four crossings. A spreadsheet works; so do free tools such as the pricesensitivitymeter package for R.
- Read the range, not just a point. The space between PMC and PME is usually more useful than any single "optimal" number.
A worked example (illustrative)
The following product and prices are hypothetical. They show how to read the crossings; they are not results from a study.
A small software company is launching a scheduling tool for independent fitness studios. It recruits studio owners, shows a one-paragraph description, and asks the four questions. After cleaning the data and plotting the curves, imagine the crossings land like this: PMC at $19 a month, OPP at $29, IPP at $35, PME at $49.
Using the definitions above, the team would read $19 to $49 as the acceptable range, with $29 as the point where equal shares reject the price as too low and too high. The $35 indifference point means equal shares call the price cheap and expensive. These crossings do not show how many people would buy or establish that $29 is the right price. The team could use the range to choose prices for a test with real offers.
What the survey cannot establish
- It measures perception, not purchase. The four questions say nothing about whether someone will actually buy at a given price. The Newton, Miller and Smith extension (1993) adds two purchase-likelihood questions to estimate the price that maximizes reach or revenue, and the pricesensitivitymeter package supports it.
- Respondents need a reference point. As a Penn State course page on the method notes, it assumes people understand what the product is worth, which is weak for radically new products (Penn State, Van Westendorp Meter).
- It does not suit luxury goods, where demand can rise with price, according to the same source.
- It ignores competition unless your description includes the alternatives buyers would compare you with.
- It is one input. Use it alongside cost, competitor prices and what real customers do when you ask them to pay.
Can you run Van Westendorp on an AI panel?
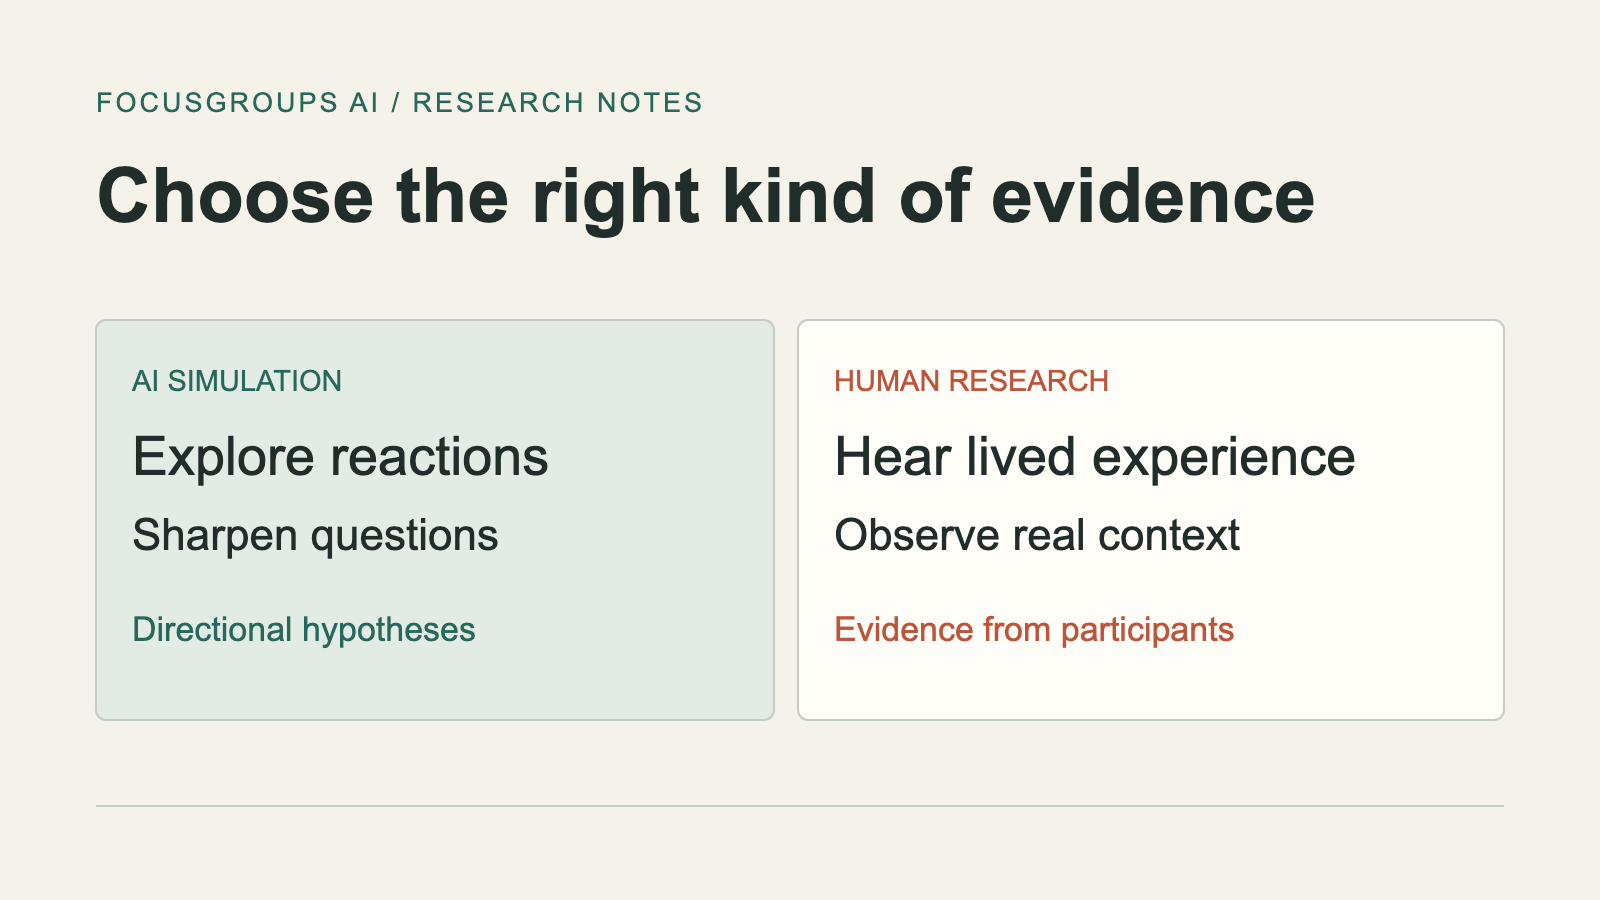
You can ask AI personas the four questions, and it can be a useful first read. It is not real willingness-to-pay data, and it should never set your price on its own.
In a working paper summarized by the Marketing Science Institute, researchers from Microsoft and Harvard Business School found that a baseline language model could simulate willingness to pay for existing product features, but needed fine-tuning on prior human survey results to do so for new features, and that fine-tuning may not carry over to unrelated product categories. For a new product, do not assume a general-purpose model can reproduce buyer responses without relevant human research.
Use an AI panel to prepare questions for buyers:
- Testing your description. If personas misread what is included, check for ambiguous wording before recruiting respondents. Confirm the description with real people.
- Finding the reference prices people will reach for. Ask what they would compare the product with. Those anchors belong in your real survey.
- Hearing objections to a price. A one-on-one interview can probe why a price feels high, which a survey number cannot.
How a user would set this up on FocusGroups AI: describe the buyer and generate a panel, then run the four questions as four open-ended AI polls (1 credit each), or take one persona through a deep dive interview (3 credits) about how they would decide. Use the generated explanations to revise your survey questions. Do not plot persona answers as if they were a real sample. Then run the actual Van Westendorp survey with real buyers. Credit costs are from our pricing page as of November 1, 2026. Our pricing research page covers more ways to use a panel for price and packaging questions, and our synthetic users guide explains the limits in more detail.
We make FocusGroups AI, the optional AI panel tool mentioned here. Responses from AI personas are simulated, not willingness-to-pay data from real buyers.
Sources
- Van Westendorp, P. (1976), "NSS-Price Sensitivity Meter (PSM): A new approach to study consumer perception of price," Proceedings of the 29th ESOMAR Congress, 139 to 167 (cited via the sources below)
- Newton, D., Miller, J. and Smith, P. (1993), "A market acceptance extension to traditional price sensitivity measurement," Proceedings of the AMA Advanced Research Techniques Forum (cited via the sources below)
- Alletsee, M., pricesensitivitymeter: Van Westendorp Price Sensitivity Meter Analysis, R package documentation, CRAN
- Penn State, Van Westendorp Meter, course material
- Wikipedia, Van Westendorp's Price Sensitivity Meter
- Brand, Israeli and Ngwe, Using LLMs for Market Research, Marketing Science Institute working paper summary